Infographic: Africa's Exploding Tech Startup Ecosystem
Save to Inbox
Africa’s Exploding Tech Startup Ecosystem
In terms of economic potential and growth, Africa has never been more important on the world stage.
Africa is home to the fastest growing cities, and more than half of the world’s population growth will take place on the continent over the coming decades. By 2050, cities like Lagos and Kinshasa will be global megacities, each holding well over 30 million inhabitants.
Africa is also at the start of a technological renaissance. It was recently reported by WeAreSocial that 7 of 10 of the world’s fastest growing internet populations are in Africa – the beginning of a trend that will likely re-shape entire economies as new companies leapfrog established technology, ideas, and infrastructure.
That said, much of that opportunity lies in the future. As of today, internet penetration is just 29% throughout Africa, meaning that the majority of growth and network effects are still to come.
A New Startup Ecosystem Emerges
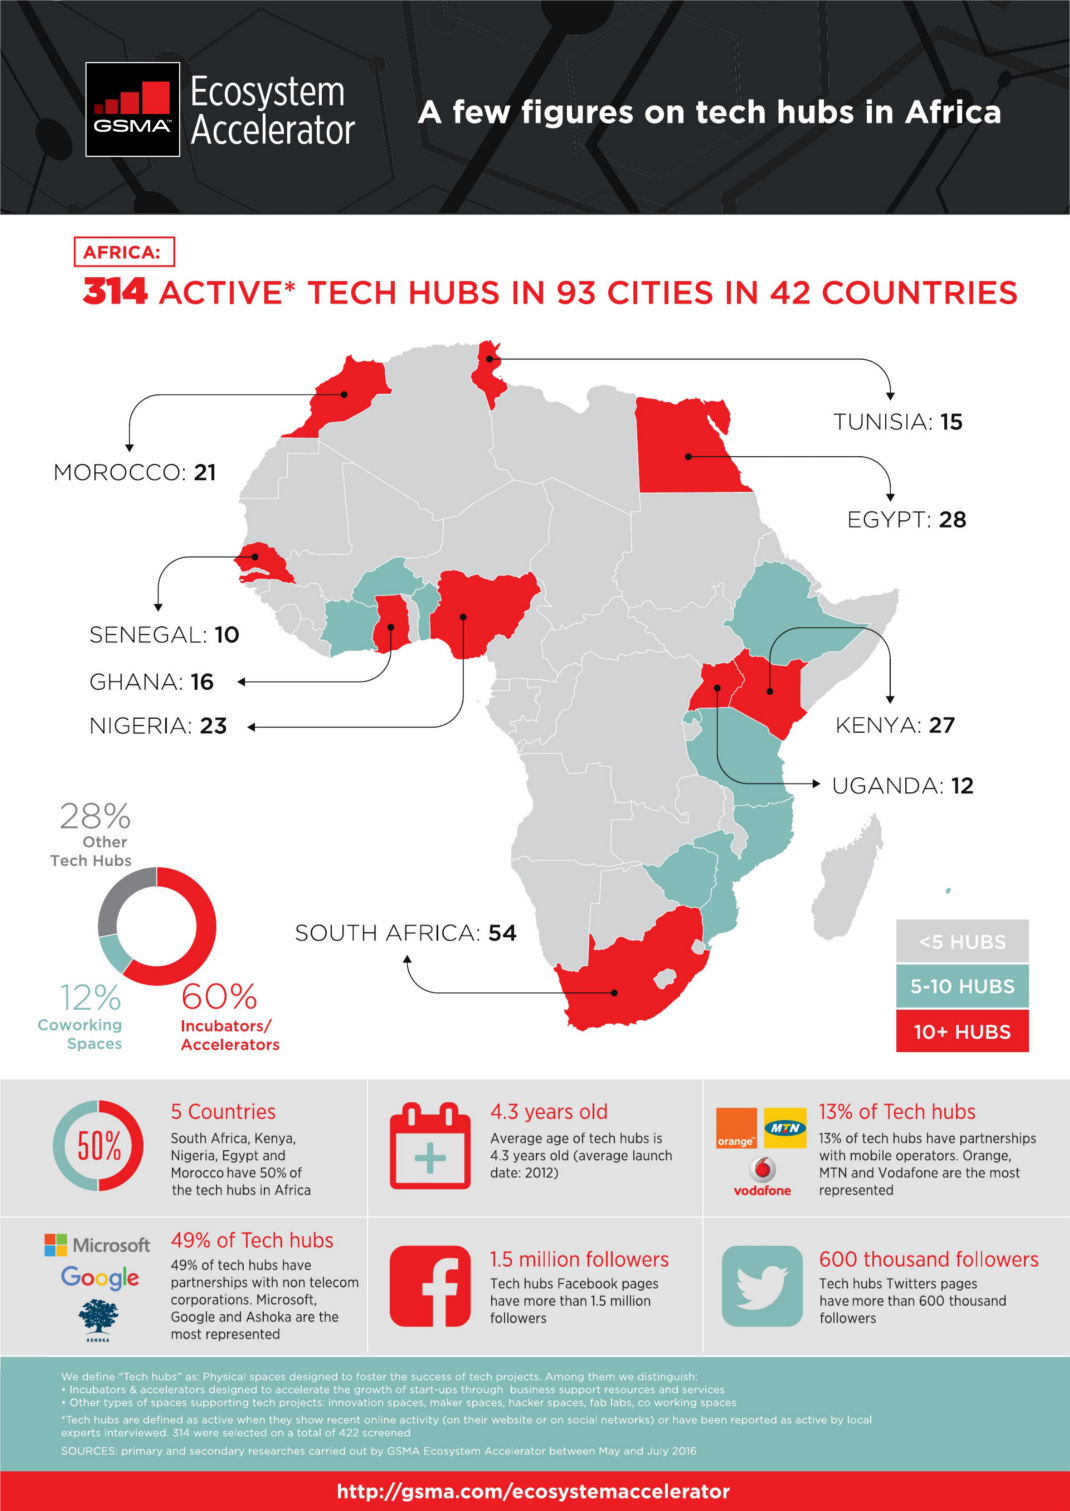
Today’s infographic from GSMA shows the 300+ hubs that have emerged in the African tech startup ecosystem. Many of these plan to take advantage of the aforementioned growth potential, including the 360 million smartphone owners expected on the continent by 2025.
Investors are recognizing the potential as well. Last year, it was estimated that African startups raised a record-breaking total of $366.8 million in investment.
Here’s that distribution sorted by country:
In what sectors did most of the action happen? According to a separate report by Disrupt Africa, the fintech sector received the most funding in 2016, but the agri-tech sector saw the biggest percentage growth as compared to the previous year.
Other sectors that got substantial amounts of attention include solar, health, e-commerce, entertainment, and e-learning.
Unique Opportunities
Every startup ecosystem is different, and hubs in Africa are no exception.
In particular, the continent has a unique wrinkle that also presents a huge opportunity: according to the African Development Bank, about 55% of sub-Saharan Africa’s economic activity is informal.
The [informal economy] is a massive commercial space without such services as business enterprise software, small business banking, affordable third-party logistics or internet access. Expect VC-backed startups to attempt scalable applications for nearly every corner of Africa’s informal economy.
The [informal economy] is a massive commercial space without such services as business enterprise software, small business banking, affordable third-party logistics or internet access. Expect VC-backed startups to attempt scalable applications for nearly every corner of Africa’s informal economy.
– Jake Bright, World Economic Forum
Last year, Africa Internet Group became the first unicorn on the continent after receiving investments from Goldman Sachs, Rocket Internet, AXA Group, Orange, and others.
It’s also certain to be just one of many born on the African Savannah.
Animation: The World’s Population in 2100 by Region
How Much State Debt Rests on Your Shoulders?
Ranked: Where the iPhone 18 Pro Costs the Most
Ranked: Where the iPhone 18 Pro Costs the Most
Ranked: The 10 Youngest U.S. Billionaires on the Forbes 400
Ranked: The 10 Youngest U.S. Billionaires on the Forbes 400
The World’s Richest Person Every Year Since 1987
The World’s Richest Person Every Year Since 1987
The New World Map the UN Wants You to Use
The New World Map the UN Wants You to Use
Ranked: The World’s Largest Cities (1950-2100)
Ranked: The World’s Largest Cities (1950-2100)
Where the World Is Burning in 2026
Where the World Is Burning in 2026
Mapped: The Countries Developing the World’s AI Models
Which countries lead AI development? Explore why the U.S. dominates, China’s growing influence, and Europe’s challenges.
Published
By
Ranked: Which Countries Build the Most AI Models?
Key Takeaways:
The global race to develop artificial intelligence is overwhelmingly concentrated in two countries: the United States and China.
This visualization uses analysis from the World Bank’s World Development Report 2026, based on Epoch AI’s model dataset from May 2026, to show where AI models are being developed.
Which Countries Develop the Most AI Models?
The following table ranks economies by their share of AI models, according to the World Bank’s analysis of Epoch AI data.
The U.S. leads with 50%, followed by China at 24%. The UK is a distant third at 5.2%, while Canada ranks fourth at 3.1%. No other individually listed economy exceeds 2.3%.
Why Does the U.S. Dominate AI Development?
America’s advantage comes from its combination of venture capital, leading technology companies, research talent, and computing infrastructure.
Companies including OpenAI, Google, and Anthropic benefit from an established cloud ecosystem and access to advanced semiconductors. Federal research funding and policies supporting domestic chip production have also strengthened this environment.
The country’s leadership extends beyond developing models to operating some of the world’s most widely used AI chatbots.
Is China Closing the AI Gap?
China’s 24% share trails America’s substantially, but model quantity does not necessarily indicate technological capability. Chinese developers including DeepSeek and Alibaba have narrowed the performance gap with leading American systems, particularly through lower-cost and open-weight models.
Although China has considerable influence over the critical minerals powering AI infrastructure, access to advanced chips, computing capacity, and capital remains crucial.
Why Is Europe Falling Behind?
Europe’s relatively small shares reflect challenges including fragmented capital markets, fewer large-scale technology investors, and limited access to computing infrastructure. Regulatory uncertainty may also complicate investment, although Europe’s position cannot be attributed simply to skepticism about AI.
Falling behind in model development could increase dependence on American and Chinese providers, potentially limiting Europe’s control over AI infrastructure and future innovation.
Nevertheless, the World Bank emphasizes that countries can capture substantial economic benefits by adapting existing AI systems rather than developing expensive frontier models themselves.
Learn More on the Voronoi App
To explore how the two leading AI powers compare beyond model counts, see Comparing U.S. vs. Chinese AI Model Performance on Voronoi.
Ranked: 15 Popular Smartphones by Radiation Levels
Compare smartphone radiation levels across 15 popular models, ranked by maximum head SAR, from the iPhone 17 to Samsung devices.
Published
By
Which Popular Smartphones Have the Highest Radiation Levels?
Key Takeaways
Every smartphone uses radiofrequency waves to communicate with cellular networks, but the amount of energy absorbed during standardized testing can vary significantly between devices.
Using data from Germany’s Federal Office for Radiation Protection (BfS), this visualization ranks 15 popular smartphones by their maximum head Specific Absorption Rate (SAR), measured in watts per kilogram (W/kg).
These measurements offer a standardized way to compare phones, but higher SAR readings do not necessarily indicate greater health risks. Smartphone radiofrequency waves are non-ionizing, unlike higher-energy radiation such as X-rays, and health authorities have not established that exposure from mobile phones within applicable safety limits causes adverse health effects.
Ranking Smartphone Radiation Levels
SAR measurements can differ depending on whether a phone is tested at the ear or near the body. The table below compares both measurements for 15 popular smartphones, ranked by their maximum head SAR values.
Apple occupies the top two positions, with the iPhone 17 and iPhone 16e separated by just 0.01 W/kg.
Samsung’s Galaxy Z Fold7 follows at 1.40 W/kg, ahead of the Galaxy S26 at 1.21 W/kg. At the other end of the ranking, the Galaxy A16 5G records 0.38 W/kg, the lowest reading among the 15 devices.
Head and Body Measurements Tell Different Stories
A smartphone’s position in the ranking can change depending on whether SAR is measured at the head or near the body.
Motorola’s Razr 60 ranks 11th for head SAR at 0.84 W/kg, but its body SAR of 1.39 W/kg is tied for the fourth-highest reading among the 15 devices.
Google’s Pixel 9 shows a similar pattern, with a body SAR of 1.40 W/kg compared with a head SAR of 0.99 W/kg. Apple’s iPhone 17, meanwhile, measures 1.49 W/kg in both tests.
These measurements come from different standardized testing configurations and do not represent typical daily exposure.
Why Radiation Levels Vary Across Smartphone Brands
SAR readings do not necessarily follow a consistent pattern based on brand, price, or smartphone generation.
Google’s Pixel 9 and Pixel 10 both record a maximum head SAR of 0.99 W/kg. Xiaomi’s Poco X7 Pro and Xiaomi 17 also share the same reading, at 1.00 W/kg.
Motorola’s three featured devices fall within a relatively narrow range, from 0.84 W/kg for the Razr 60 to 0.95 W/kg for the Edge 60.
Factors such as antenna design, operating frequencies, and testing conditions can influence SAR measurements. Because these readings are specific to individual devices, they cannot be used to characterize an entire smartphone brand.
Smartphones also differ in the materials and components used in their construction. Our visualization of the critical metals inside a smartphone looks at the resources used to manufacture modern mobile devices.
Does Higher Smartphone Radiation Mean Greater Health Risk?
Not necessarily. SAR measures the maximum rate at which radiofrequency energy is absorbed by tissue during standardized testing. It does not measure a person’s cumulative exposure throughout a typical day.
The amount of radiofrequency energy a phone transmits varies with signal strength and other network conditions. Keeping the phone away from your head, such as by using speakerphone or headphones, can also reduce exposure.
Unlike ionizing radiation, radiofrequency waves do not have enough energy to directly ionize atoms or damage DNA in the way that X-rays can.
According to the U.S. Food and Drug Administration, the weight of scientific evidence has not linked cellphone radiofrequency radiation with health problems. Research and safety monitoring continue.
Ultimately, these rankings compare maximum SAR measurements under laboratory conditions, not which smartphones are safer or more dangerous to use.
Learn More on the Voronoi App
If you enjoyed this visualization, check out The Percentage of Internet Users by Country on the Voronoi app.
Ranked: The Most and Least Trusted Professions in 2026
Ranked: The Most and Least Trusted Professions in 2026
Ranked: Countries With the Smartest Students in 2026
Ranked: Countries With the Smartest Students in 2026
Ranked: Births vs. Deaths in 12 Major Countries
Ranked: Births vs. Deaths in 12 Major Countries
Ranked: The World’s Most Welcoming Countries in 2026
Ranked: The World’s Most Welcoming Countries in 2026
The World’s Largest Militaries, by Four Different Measures
The World’s Largest Militaries, by Four Different Measures
Where Each U.S. State Gets Its Tax Revenue From
Where Each U.S. State Gets Its Tax Revenue From
Mapped: Unemployment Rates Around the World in 2026
Mapped: Unemployment Rates Around the World in 2026
Mapped: Unemployment Rates Across Europe in 2026
Mapped: Unemployment Rates Across Europe in 2026
Originally published and reported by Visual Capitalist.
Read original coverage on Visual CapitalistRelated Topics
Keywords
Related Stories
Labubu hype seemed unstoppable, now the fluffy monster mania is dying
Parent company Pop Mart's revenue has fallen as appetite for the quirky collectible monsters wanes.

Can New Zealand's new government win over disillusioned voters?
Polling shows the mood among Kiwis is low, with faith in politics even lower - with voters deserting the main parties at the polls.

'My mortgage is going up £200': How rising interest rates are hitting people's pockets
With UK interest rates set to rise, mortgages, credit cards and loans could get more expensive for millions.

Why the US midterms sparked an AI stock selloff
Fears of more AI regulation appear to have sparked fear among investors, but concerns about the industry have been growing for some time.

Top Stories

Billam-Smith stopped as Clarke repeats amateur win

Ambika Mod says the 'glass ceiling is always getting higher' for South Asian actors

The rise of microdramas: The 'snackable' shows made for the scrolling age

Can the Zelda remake capture the magic of the original?

'Dana, please take the job!' - Trump asks UFC boss to be White House press secretary
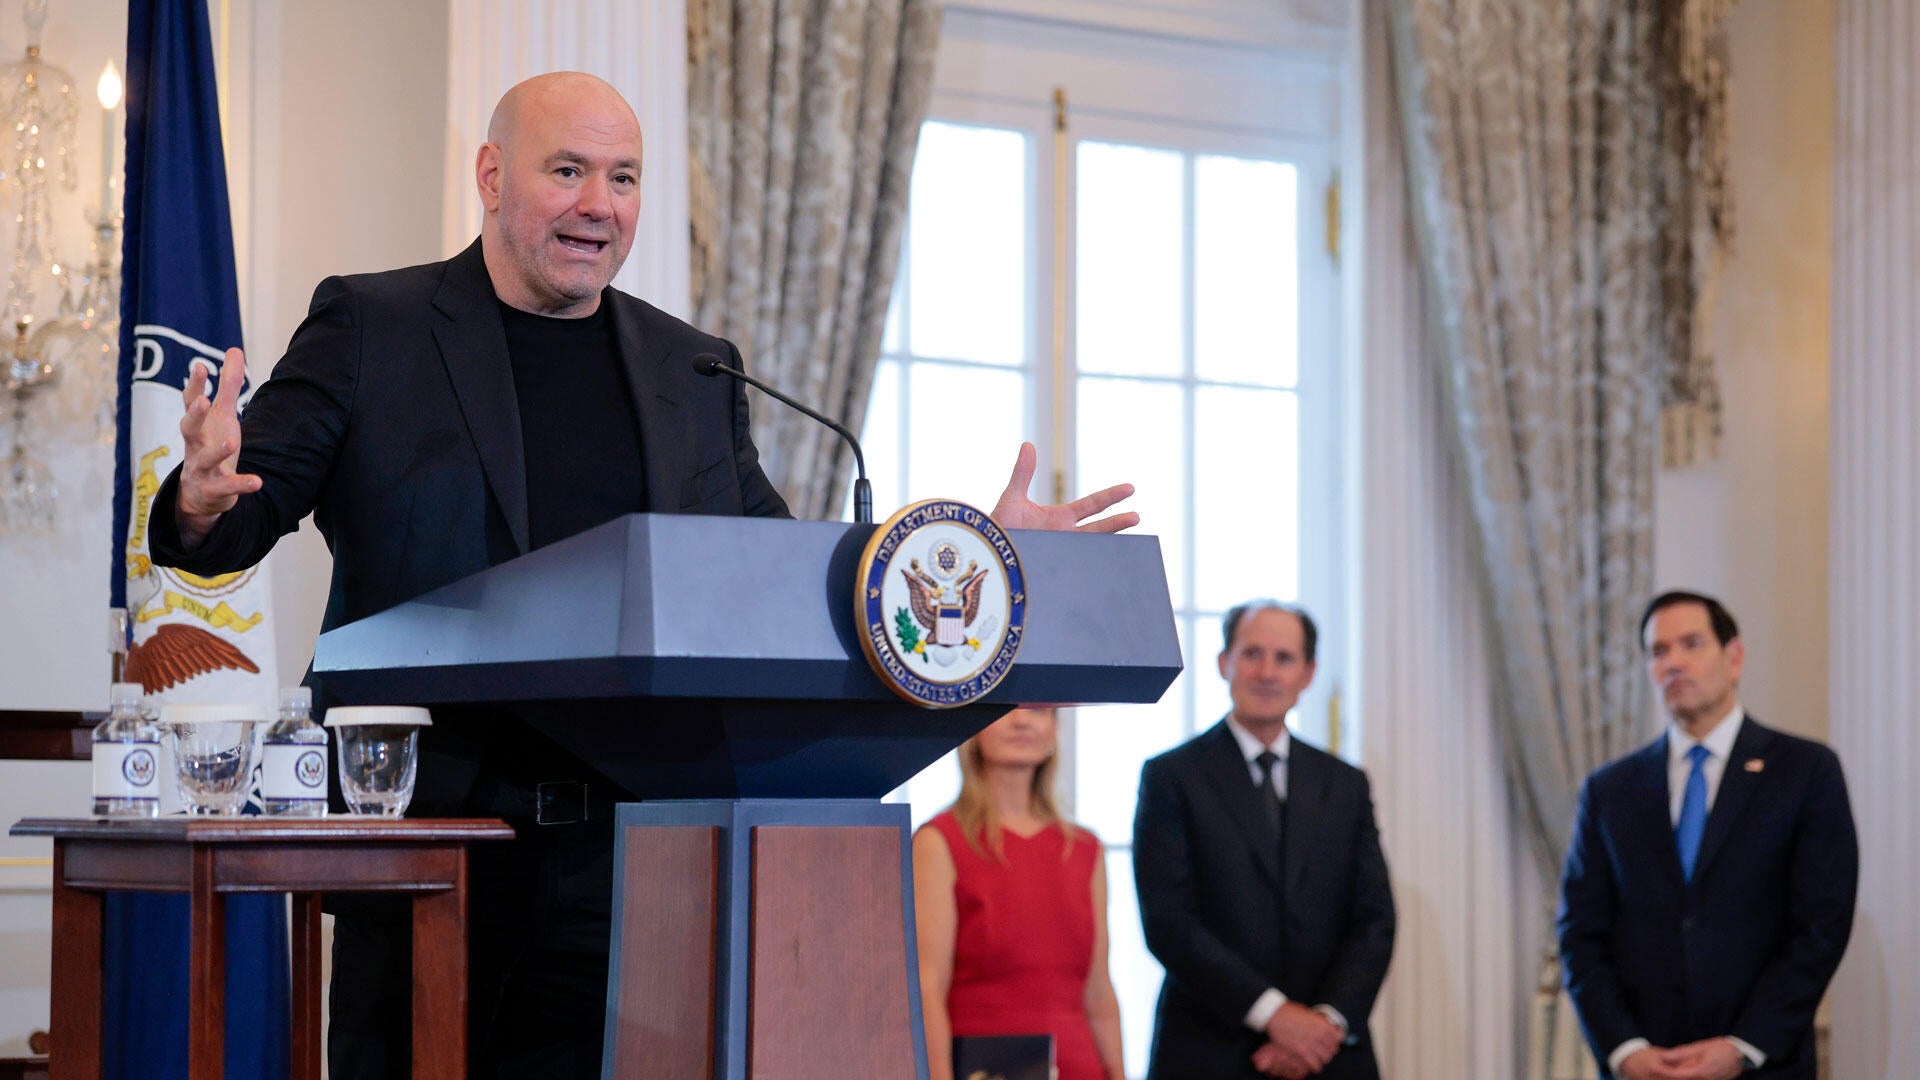
Dana White next White House press secretary? UFC boss set for meeting with President on Monday

'The worst conditions in my 35-year career' - commentating in the FA Cup fog

'Curtains for Robinson' or can floundering Aberdeen boss survive?
Latest
Billam-Smith stopped as Clarke repeats amateur win
Ambika Mod says the 'glass ceiling is always getting higher' for South Asian actors
The rise of microdramas: The 'snackable' shows made for the scrolling age
Can the Zelda remake capture the magic of the original?
'Dana, please take the job!' - Trump asks UFC boss to be White House press secretary
Dana White next White House press secretary? UFC boss set for meeting with President on Monday
'The worst conditions in my 35-year career' - commentating in the FA Cup fog
'Curtains for Robinson' or can floundering Aberdeen boss survive?