Three hundred thousand years of multi-millennial hydroclimate variability in Northern Africa based on speleothem records from Tunisia
Subjects
Abstract
Hydroclimate changes in Northern Africa reflect the interplay between mid-latitude westerlies and the West African monsoon, along with their intensity variations. The response of these atmospheric circulation systems to changing boundary conditions and their impacts on the precipitation during past episodes of climate change remain unconstrained, because of scarcity of well-dated terrestrial hydroclimate records from Northern Africa that reach beyond the Holocene interglacial. We present a 300,000-year hydroclimate record inferred from periods of speleothem formation from Tunisia, located in the northernmost Africa. This record captures the alternation of humid and arid phases during glacial and interglacial climate states, as well as the superimposed millennial-scale events. Humid conditions prevailed during the interglacial periods, while arid conditions were associated to glacial boundary conditions. Cave evidence suggests that these humid phases in northernmost Africa could mainly be attributed to the southward shift and strengthening of the mid-latitude westerlies and the Mediterranean storm track during interglacials, and vice versa in glacials. A comparison with palaeolake records from the Sahara suggests suggests that during interglacials winter westerlies and the summer West African Monsoon were crucial to bring moisture in Northern Africa, contributing to the development of wet conditions in the Sahara.
 The alternative text for this image may have been generated using AI.
Orbital controls on eastern African hydroclimate in the Pleistocene
Article Open access 24 February 2022
Reversed Holocene temperature–moisture relationship in the Horn of Africa
Article Open access 09 August 2023
Astronomically controlled aridity in the Sahara since at least 11 million years ago
Article 25 July 2022Introduction
Northern Africa holds significant importance due to its unique geographical setting, dominated by the Sahara Desert, the largest hot desert, which emits over 1150 million tons of dust annually1. This region also serves as one of the cradles of hominin developments2,3. It straddles the boundary between the Sahara Desert to the south and the Mediterranean Sea to the north, with the seasonal precipitation patterns influenced by the meridional shift of the regional atmospheric and oceanic circulation patterns4. Palaeoclimate data5,6,7,8 and model simulations9,10 suggest that at orbital timescales, precipitation in Northern Africa could originates from two distinct sources: the mid-latitude westerlies with the associated Mediterranean storm tracks, dominating during boreal winter, and the West African Monsoon (WAM), prevailing during boreal summer.
During precession minima, stronger insolation during Northern Hemisphere (NH) summer and a strengthened tropical insolation gradient11 intensified the WAM by enhancing the land-sea thermodynamic contrast, specifically between western Africa and the tropical Atlantic Ocean12. Other relevant relevant to monsoon development include the seasonal intensification of the tropical circulation13, the North Atlantic temperature14, and the feedback related to the changing vegetation cover, land surface, and airborne dust12. WAM intensification is generally considered central to the recurring pattern of African Humid Periods (AHPs) that punctuated the otherwise dry climate of Northern Africa over the past 8 million years15, albeit discrepancies in the model-data comparisons preclude a conclusive understanding of the underlying causal mechanisms12. During the AHP, the savannah expanded northward at the expenses of the hyperarid environments of the Sahara Desert16, favouring the migration out of Africa and the evolution of hominins, e.g., during the last interglacial AHP16. The most recent AHP lasted from approximately 14.5 to 5 thousand years ago (ka, relative to AD 1950 hereafter), peaking from11 to 6 ka12,17 and it is generally attributed to intensification of the WAM and a northward migration of the intertropical convergence zone (ITCZ), triggered by the early Holocene NH summer insolation maximum18,19.
Past hydroclimate changes in Northern Africa have been also linked to the position of westerlies and the tracks of winter cyclones, driven by pressure fields over the North Atlantic Ocean20,21,22. Minima in the precession cycle reduced the NH winter insolation, which weakens the equator-to-pole temperature gradient and shifts the westerlies and the Mediterranean storm track southwards, enhancing winter precipitation in Northern Africa9. A recent study6 combined proxy data with a vegetation model revealing that a dual precipitation regime, consisting of winter precipitation fuelled by the westerlies and the Mediterranean storm track, and summer precipitation fuelled by the WAM, sustained the most recent AHP. This finding aligns with palaeovegetation evidence and past river runoff data23. However, most terrestrial proxy records from Northern Africa cover only the Holocene (last 11.7 ka) and/or the preceding transition of the last deglaciation (19.0-11.7 ka) following the Last Glacial Maximum6,7, limiting our understanding of the response of the regional hydroclimate to changing boundary conditions across multiple glacial-interglacial cycles. Speleothem (stalagmites, stalactites and flowstones) formation and growth proved to be a valuable hydroclimate indicator24,25,26,27. During humid periods, rainfall recharges karst aquifers, thus sustaining speleothem growth. During prolonged arid spells, the aquifer above the cave is not recharged, resulting in the cessation of speleothem growth25,27,28,29. Hence, the timing of speleothem formation can be used as a reliable hydroclimate indicator in Northern Africa.
Here, we use U-Th dating techniques30 to constrain the timing of speleothem growth durations in Northern Tunisia during the last 300 ka. Contemporary northern Tunisia has typical Mediterranean climate characterized by hot and dry summers and mild and wet winters (Fig. S1). During winter, westerlies and winter storms deliver moisture from the North Atlantic and the Mediterranean Sea31. In summer, a subtropical high-pressure system prevails, bringing dry air to the region20. The instrumental time series (1967–2006) from the Tunisia weather station (36.83°N, 10.23°E) reveal an average annual temperature of 18.7 ± 0.3 °C (2σ, hereafter) and precipitation of 443 ± 46 mm yr–1 (Global Network of Isotopes in Precipitation, IAEA Water Isotope System for Electronic Retrieval database). August features the warmest temperature of 27.1 ± 0.4 °C, while January is the coldest month with low temperature of 11.4 ± 0.4 °C. July and August are the driest months (8.3 ± 4.5 mm and 10.2 ± 3.2 mm), while December is the wettest month (68 ± 17 mm).
Speleothems were retrieved in two caves, Ghar Kriz Cave (36.44°N, 9.38°E, >500 m above sea level (a.s.l.), site 1 in Fig. 1) and La Mine Cave (36.03°N, 9.68°E, 975 m a.s.l., site 2 in Fig. 1), located in north-central Tunisia (see Methods). The caves are cut in Early Cretaceous (Aptian-Albian), fractured, reefal limestones and likely developed since the Miocene-Pliocene period32. Specifically, the La Mine cave opens at high altitude on the SE side of a peak, in a “steppe-like” environment and is, thus, sheltered from modern moisture sources, which makes it highly sensitive to changes in moisture trajectories32. La Mine Cave is situated in the central geographical zone, while Ghar Kriz Cave is located in the northern zone. The Ghar Kriz record, from lower altitude and nearer to the Mediterranean Sea, is here combined with the La Mine to replicate its data and refine information about past shifts in moisture sources.
 The alternative text for this image may have been generated using AI.Full size image
1: Ghar Kriz Cave (this study). 2: La Mine Cave (this study). 3: Core 64PE349-823. 4: Susah Cave8. 5: Wadi Sannur Cave48. 6: Saqia Cave26. 7: Soreq Cave45. 8: Core ODP 96754. 9: Lake Van43. 10: Lake Ohrid42. 11: Corchia Cave44. 12: Ejulve Cave72. 13: Gueldaman GLD1 Cave47. 14: Chaara Cave46. 15: Lake Tislit6. 16: Wintimdouine Cave5,7. 17: Core U131350. 18: Core GeoB9508-534. 19: Lake Bosumtwi35. The black dashed lines sketch the modern positions of the ITCZ in summer and winter16. The white dashed lines mark the boundaries of the megalakes’ catchments and their extent73. The yellow arrows illustrate the directions of moisture sources of the westerlies and the West African Monsoon. The basemap created using GeoMapApp (www.geomapapp.org) / CC BY74.
Overall, our new speleothem growth data suggest that humid conditions dominated during interglacial periods, whereas glacial periods were characterized by arid conditions, over at least the past 300,000 years.
Results
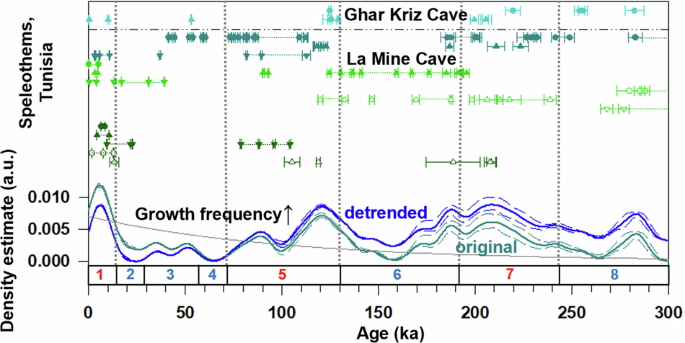
The U-Th isotopic compositions, concentrations, and the 132 ages obtained on 21 speleothems from Ghar Kriz and La Mine Caves are reported in Fig. 2a and listed in tables in Supplementary. The age distribution indicates that the speleothem dataset covers a time span from glacial marine isotope stage (MIS) 8 to the present Holocene interglacial (MIS 1), albeit discontinuously. Over 50% of the speleothem samples are characterized by growth interruptions (hiatuses), and most age determinations cluster around interglacial periods. Specifically, seven speleothems grew during MIS 7 (243–191 ka), nine during MIS 5 (130–71 ka), and ten during MIS 1 (14 ka to present). Thirteen speleothems grew during the cold stages within MIS 8 from 300 to243 ka (four of specimens), MIS 6, from 191 to 130 ka; (five of specimens), and from MIS 4 (71–57 ka) to MIS 2 (29–14 ka), including MIS 3 (57–29 ka) (five of specimens). We cannot discard the possibility that additional periods of no-growth (hiatuses) occurred between the inferred ages of speleothem growth from our dating dataset, as illustrated in Fig. 2a. Consequently, we indicated with dashed lines the potential for continuous deposition of stalagmites in Fig. 2a.
 The alternative text for this image may have been generated using AI.Full size image
a All 125 ages with 2-sigma (2σ) uncertainties, denoted with different colours, from Ghar Kriz and La Mine Caves, separated by a dashed-dot line. b Kernel Density Estimate (KDE) curves with 2σ uncertainty envelopes (dashed lines). The blue curve represents the detrended data obtained by removing the exponential trend (grey line) from the original green curve.
In Ghar Kriz Cave, specimens GH1 and GH2 grew over MIS 8, 7, 5, 3, and 1. GH1 yields ages of ~282 ka and ~255 ka (within MIS 8), ~220 ka (MIS 7), and ~125 ka (MIS 5e). GH2 was intermittently deposited from MIS 7 to MIS 1. As for La Mine Cave, 19 speleothem specimens exhibit ages ranging from MIS 8 to MIS 1. In the westernmost cave passage, labelled as 3 in Fig. S2b, stalagmites LAM-2, LAM-4, and LAM-8 mainly grew during interglacials MIS 7, 5, and 1. In the middle part of the cave, labelled as 4 in Fig. S2b, speleothem ages spread from MIS 8 to MIS 1, including LAM22-2 (196-124 ka) in MIS 6 and LAM22-3 (39-31ka and 17-43 ka) from MIS 3 to the end of MIS 2 (Last Glacial Maximum) glacial periods. In the central cave chamber, labelled as 5 in Fig. S2b, approximately half of the speleothem grew during the Holocene (MIS 1).
Relatively young specimens are more commonly found on the present-day floor of a cave24,28, even though we attempted to avoid bias from human selection in growth position by collecting only two actively growing specimens in situ. The observed collapsed blocks from the ceiling on the ground and natural attrition are also two possible biases in the age frequency data24. We cannot rule out potential bias on age frequency caused by blocks collapsed from the ceiling, as observed in La Mine Cave (Fig. S3d). These might have buried fossil and older specimens. To account for this potential bias, which could be related to the seismotectonics of the regions33 and, thus, isolate real growth (hydroclimate) signals, we subtracted an exponential baseline from the age distribution curve. The resulting detrended kernel density estimate (KDE) (Fig. 2b; Methods) reveals five major peaks in growth frequency, centred at 281 ka, 207 ka, 119 ka, 88 ka, and 6 ka, and three minor peaks at 187 ka, 51 ka, and 35 ka, with intervening troughs at 264, 158, 100, 65, and 23 ka.
Hydroclimate evolution of Northern Africa since 25 ka
Speleothem growth ages from north-central Tunisia occurred primarily during the interglacial periods of the past ~300 ka, suggesting that interglacial boundary conditions generally favoured humid climates in the region, while glacial times were relatively dry. Focusing on the last 25 ka, U-Th ages and their KDE analysis from Ghar Kriz and La Mine Caves (Fig. 3b) document a maximum of speleothem growth during the most recent AHP. The high frequency of speleothem growth during the most recent AHP demonstrates the reliability of the detrended KED curve in representing multi-millennial hydroclimate variations. Traditionally, greening of the Sahara is attributed to an intensification of the WAM, in line with the change recorded in the plant wax n-alkane δD time series from both the continental slope off Senegal34 (Fig. 3f) and Lake Bosumtwi in Ghana35 (Fig. 3g).
 The alternative text for this image may have been generated using AI.Full size image
a Ages with 2-sigma (2σ) uncertainties of speleothems, denoted with different colours, from Ghar Kriz and La Mine Caves, separated by a dashed-dot line. b The curves of KDE (green lines) with 2σ uncertainty envelopes (green dashed lines) and the detrended KDE (blue line) with 2σ uncertainty envelopes (blue dashed lines) (from Fig. 2b, Methods). c The δ13C (purple line) and δ18O (blue line) of the stalagmite, Min-stm1, from La Mine Cave37 (site 2 in Fig. 1). d The pollen-based reconstructions of winter (DJF) precipitation from Lake Tislit6 (site 15 in Fig. 1). e The pollen-based reconstructions of summer (DJF) precipitation from Lake Tislit6 (site 15 in Fig. 1). f The δD of plant wax n-C31 alkane, corrected for ice volume effect, in the sedimentary Core GeoB9508-534 (site 18 in Fig. 1). g The δD of plant wax n-C31 alkane, corrected for ice volume effect, in Lake Bosumtwi35 (site 19 in Fig. 1). The light yellow bar represents the timing of the most recent African Humid Period (AHP), whereas the dark yellow bar denotes the peak of this AHP. WAM in f and g refers to the West African Monsoon.
Speleothem records from Morocco spanning the past millennium suggest a link between centennial-scale humid periods in Northern Africa36 and the southward shift of the westerlies, driven by solar forcing22. The stable hydrogen isotope and pollen time series from Lake Tislit (32°N) in Morocco (Fig. 1), supported by a vegetation model, reveal an early Holocene increase in the regional winter rainfall (Fig. 3d), associated to incursions of the Mediterranean rainfall zone that reached as far south as the northern Sahara6. In contrast, summer rainfall displays negligible changes during the early Holocene6 (Fig. 3e), further supporting the idea that the observed increase in humidity at these latitudes during the most recent AHP was due to winter, rather than summer precipitation6. The westerlies and the Mediterranean storm tracks in winter moved southwards, causing Mediterranean (winter) precipitation maxima to coexist with that of the WAM (summer) between 18°N and 24°N during the early Holocene, sustaining humid conditions over a region that is today hyperarid6. Our data from Ghar Kriz and La Mine Caves at ~36°N support the southward shift and/or intensification of the mid-latitude westerlies and the Mediterranean storm track during the most recent AHP. This shift/intensification accounts for the increased deposition of speleothems—and consequently, the enhanced infiltration (humidity)—documented for Ghar Kriz and La Mine Caves during the interglacial periods over the last ~300 ka. Notably, this explanation does not rely on direct precipitation from the WAM, as its influence did not reach up to Lake Tislit 32°N latitude.
The stable carbon (δ13C) and oxygen (δ18O) isotopic ratios of the stalagmite Min-stm1 from La Mine Cave37 (Fig. 3c) indicate a significant increase in humid conditions, starting around 11 ka, which coincided with the peak of the most recent AHP according to the WAM records (Fig. 3g). On a millennial scale, the timing of the AHP in the δD record from Lake Bosumtwi (Fig. 3g) features two major peaks at around 9.5 and 4.5 ka that match the timing of our speleothem growth (Fig. 3a). The troughs of δD data from Lake Bosumtwi correspond to the deposition of only 2 speleothems from 17.8 to 14.8, another 2 from 13.4 to11.0, three around 5.9, and 3 after 2.0 ka. The plant δD records from the Senegal seashore and Lake Bosumtwi can reflect the intensity of the WAM35, while the speleothem formations in Tunisia reflect changes in precipitation mainly driven by the westerlies with winter storms. This relationship demonstrates a synchronized pattern between the δD values observed along the Senegal seashore and Lake Bosumtwi, as well as the δ13C and δ18O values from Min-stm1 and the growth of Tunisian speleothems. These findings imply a coherent interaction between the westerlies with winter storms and the WAM over the past 25 ka in Northern Africa, with both the westerlies and the WAM contributing to increased humidity during the AHP. This concurrence is further supported by the timings of the most recent AHP, which was influenced by the WAM from 14.5 to 5.0 ka, and the most recent West Mediterranean Humid Period (WMHP), primarily driven by the westerlies from 15.5 to 5.0 ka38.
The mechanism of hydroclimate variability on an orbital scale in Northern Africa
In the Mediterranean region, the meridional position of the westerlies and the associated Mediterranean storm track are highly correlated with rainfall amount. The southward shift of these moisture-laden air masses during winter fuels winter precipitation, which accounts for ~70% of annual runoff39. In northern Tunisia, 88% of the annual rainfall occurs from September to April (Fig. S1). A monitoring programme conducted in Grotte de Piste in northern Morocco40, demonstrated a significant correlation between rainfall amounts and the winter North Atlantic Oscillation (NAO) index. The NAO, defined as the difference in sea-level pressure between the Subtropical High (Azores High) and the Subpolar Low, exhibits a correlation coefficient of r = −0.66 with local rainfall40. Notably, strong Mediterranean storms can be generated during the negative phases of the NAO41, which can enhance regional rainfall.
The speleothem growth frequency (Fig. 4c) increased/decreased with the pollen percentages of deciduous oaks (Quercus) at Lake Ohrid, located on the border between North Macedonia and Albania42 (Fig. 4d) and at Lake Van in Turkey43 (Fig. 4e) during interglacials/glacials. The percentage of Quercus was positively related to soil moisture levels at Lake Ohrid42 and indicated advances and retreats of the forest at Lake Van43. The speleothem records from Corchia Cave in Italy44 and Soreq Cave in Israel45 display proxies for wet MIS 5 and 1 similar to those found in lake core records42 at an orbital scale in the western Mediterranean region (Fig. S4). The agreement between the speleothem growth frequency in Tunisia, Northern Africa, and the speleothem and pollen records from Southern Europe and Eastern Mediterranean suggests that the Mediterranean region experienced overall humid conditions during interglacial periods, while arid conditions prevailed during glacial periods, affecting not only Southern Europe and Eastern Mediterranean but also Northern Africa, during the past 300 ka. This is related to the impact of interglacial and glacial boundary conditions on the mid-latitude atmospheric circulation patterns and the positions of westerlies. During glacials, the presence of the Laurentide and Eurasian ice sheets altered the sea level pressure pattern and the position of the westerlies43, causing dry conditions in the Mediterranean and Northern Africa.
 The alternative text for this image may have been generated using AI.Full size image
a The ice-rafted debris (IRD) record inferred from the quartz to calcite ratios of the Core U131350 (site 17 in Fig. 1). b The alkenone-based sea surface temperature (SST; °C) of the Core U131350 (site 17 in Fig. 1). c The detrended KDE curve with 2σ uncertainty envelopes (dashed lines) (from Fig. 2b, Methods). d The percentage of pollen from Quercus in Lake Ohrid42 (site 10 in Fig. 1). e The percentage of pollen (on logarithmic ordinate) from Quercus in Lake Van43 (site 9 in Fig. 1). f Sea level curve75. The numbers at the bottom of the figure are the number of marine isotope stages76.
Palaeoclimate model simulations9,42 support the role of the westerlies and the associated storm tracks in the occurrence of humid periods in the Mediterranean and Northern Africa during periods of precession minima. Stronger westerlies over Northern Africa caused the low-pressure anomalies to shift southwards to around 18°N6. This could lead to increased winter precipitation affecting our study caves in Northern Africa at 36° N during interglacial periods.
Speleothem formation periods from Morocco5,7,46, northern Algeria.47, northern Libya8, and Egypt26,48, are plotted in Fig. 5b. These sites, located within the same hydroclimatic as present-day northern Tunisia, receive moisture from the westerlies and associated storm tracks5,47,48. Six Moroccan stalagmites deposited in MIS 5 and 15,7,46 and two stalagmites from Gueldaman GLD1 Cave, northern Algeria formed from 6-3 ka in the Holocene47. Their formation periods align with our Tunisian records (Fig. 5a), supporting wet conditions during MIS 5 and 1 refs. 5,7,46 Alternating wet and dry periods recorded in a stalagmite from Susah Cave8, northern Libya, indicate semi-arid conditions during MIS 3–4, consistent with the Tunisian detrended KDE record. (Fig. 5a, b). The deposition intervals of one stalagmite of Wadi Sannur Cave in Egypt occurred during the warm periods of MIS 5, 7, and 9 ref. 48. Four speleothem cores from Saqia Cave, Egypt, by Red Sea, mainly deposited in wet MIS 5 and only one segment of one core, Saqia_1 formed at MIS 6 ref. 26. Overall, speleothems in Northern Africa, from west to east (Fig. 5b), deposited primarily during interglacial periods, which is consistent with our findings from the Tunisian speleothems age distribution (Fig. 5a).
 The alternative text for this image may have been generated using AI.Full size image
a The detrended KDE curve with 2σ uncertainty envelopes (dashed lines) (from Fig. 2b, Methods). b Speleothem ages with 2σ uncertainties of 6 stalagmites from Chaara and Wintimdouine Caves5,7,46 of Morocco (light green) (site 14 and 16 in Figs. 1), 2 stalagmites from Gueldaman GLD1 Cave47 of Algeria (dark green) (site 13 in Fig. 1), 1 stalagmite from Susah Cave8 of Libya (orange) (site 4 in Fig. 1), and a double stalagmite and 4 flowstone cores from Wadi Sannur and Saqia Caves26,48 of Egypt (red) (site 5 and 6 in Fig. 1). c The African megalake dating data (Chotts: U-Th ages for shells59, Ahnet-Mouydir: U-Th ages for shells77, Fezzan: optically stimulated luminescence (OSL) ages for sediments78, Chad: OSL ages for sediments56, White Nile: 10Be age for shoreline61. Ages are marked with 2σ uncertainties. d The εNd values of the siliciclastic fraction in the sedimentary Core 64PE349-823 (site 3 in Fig. 1). e The reconstructed wet-dry index from dust proxy of the Core ODP 96754 (site 8 in Fig. 1). The numbers at the bottom of the figure are the number of marine isotope stages76. WAM in d and e refers to the West African Monsoon.
Hydroclimate change during MIS 7e and 5e
The shift in the westerlies was influenced by precession, relating to the latitudinal temperature and pressure gradients observed on an orbital scale49. A high speleothem growth frequency peak at MIS 5e matches the highest sea-level interval (Fig. 4f). During periods characterized by diminished continental ice sheets and elevated sea levels, the rise in sea surface temperatures (SSTs) likely facilitated the development of local cyclones. Additionally, these conditions contributed to the replenishment of North Atlantic low-pressure systems, which subsequently impacted the Mediterranean region and lead to increased precipitation42.
The detrended KDE distribution record (Fig. 4c) shows precipitation differences during the interglacial periods, specifically early MIS 7 (MIS 7e) and early MIS 5 (MIS 5e). The detrended KDE values show an increasing trend during MIS 7, reaching a peak at 207 ka, corresponding to the transition between MIS 7c and 7b. However, there is no clear peak during MIS 7e, with only 2-3 speleothem growth during the time from MIS 7e to 7c (Fig. 2a). The difference in the speleothem growth frequency curves between MIS 7e and 5e could be attributed to IRD events occurring from MIS 8 to 7e, as indicated by the quartz to calcite ratios (Fig. 4a), which were as high as 40, in core U1313 from the southern fringe of the last glacial IRD-belt50. During MIS 5e, low quartz to calcite ratios (Fig. 4a), 0-10, indicate the absence of IRD events. The alkenone-based SST of the middle North Atlantic from the same core, U131350, remained at around 15°C during MIS 7e and increased to around 18°C later in MIS 7 (Fig. 4b). This steady increase matches the trend of the speleothem growth frequency curve during MIS 7 (Fig. 4c). The standardized detrended growth of speleothems in Northern Africa exhibits a negative relation (y = -0.53 x, R = -0.53, P < 0.05) (Fig. S5a) with the standardized quartz to calcite ratios and a positive relation (y = 0.47 x, R = 0.47, P < 0.05) (Fig. S5b) with the standardized reconstructed SST of the core U1313 (Fig. 4a–c). This suggests a connection between circulation in the North Atlantic Ocean and precipitation in Northern Africa. The slowdown of Atlantic meridional overturning circulation, induced by meltwater input into the North Atlantic through IRD events, lead to a deepened Icelandic Low and intensified Azores High. This, in turn, forced the relatively northern shift of the westerlies in the Mediterranean region44,51, resulting in dry conditions in Northern Africa. Indeed, the pollen record (Fig. 4d) from Lake Ohrid, located at 41°N, indicates a distinct pattern of humid conditions, with a notable peak in the northern Mediterranean during MIS 7e. The speleothem records from Ejulve Cave, located at 40°N in Spain, also reveals a humid condition during MIS 7e, peaking at 240 ka (Fig. S6a). We here propose that, in contrast to MIS 5e, which shows a distinct peak in the detrended KDE curves, the absence of a clear peak during MIS 7e was related to the position of the southern boundary of the westerlies. This suggests that during MIS 7e, the southern boundary may not have extended as far south as it did during MIS 5e.
Comparison with WAM records and mega-palaeolakes
The strength of WAM has fluctuated in response to orbital-driven insolation changes16,52, with WAM intensifications leading to wet conditions in the Sahara53. The enhanced moisture transport with the WAM is a consequence of both increased insolation and an elevated tropical insolation gradient11. WAM-fuelled runoff along the Northern African margin and, more specifically, in the Gulf of Sirte was recorded in the sediment core 64PE349-823 (Fig. 5d). The elevated values of radiogenic neodymium (εNd) mainly originated from the volcanic fields of Libya. The increased rainfall with an enhanced WAM intensity transported siliciclastic sediments with elevated values of εNd to the Gulf of Sirte. A Northern African humidity versus aridity index, derived from the combination of runoff and dust signals of the core ODP 96754 (Fig. 5e) in the eastern Mediterranean, predominantly influenced by the WAM variability, highlights the impact of the WAM through increased runoff during the monsoon both strengthening and northward migration and the increased dust during the monsoon weakening and southward retreat54. The humidity/aridity index (Fig. 5e) indicates more humid conditions at MIS 6 than inferred from the speleothem growth frequency in Northern Africa (Fig. 5a) at an orbital scale. Nevertheless, the two records show a similar trend during MIS 8. During the warm MIS 5 period, the frequency of speleothem growth decreased around 98 ka, indicating an arid phase, which is also reflected in the records of εNd (Fig. 5d) and humidity/aridity index (Fig. 5e).
The growth of speleothems in Egypt observed briefly during the interglacial periods, specifically MIS 7 and 526,48 (Fig. 5b) was likely influenced by both summer rainfall from the WAM and winter rainfall from the westerlies and the Mediterranean storm track, potentially aided by the Indian monsoons26. Consequently, the speleothem growth records in Tunisia and Egypt suggests consistent humid conditions during interglacial periods across Northern Africa's west and east regions.
The presence of African megalakes has been associated with a substantial increase in precipitation and the establishment of humid corridors facilitating human dispersal across the desert55,56. The largest megalakes identified include Chad57,58, Chotts59, Fezzan55, Darfur60, White Nile61, Tushka62, and Ahnet-Mouydir56 (Fig. 5c). The megalake closest to the Tunisian cave locations is Chotts, comprised of three sub-basins in southern Tunisia and eastern Algeria. It was identified through outcrops yielding lacustrine shell-rich sediments, covering around 30,000 km2 of catchments63,64. The data from the Tunisian speleothem and African megalakes reveal some similarities. Both records show that MIS 5 was more humid than MIS 6 and 4-2 (Fig. 5a,c). MIS 6 and 4-2 were characterized by lower humidity from speleothems, with only a few stalagmites depositing in both the caves, corresponding to the presence of only two megalakes, compared to the five megalakes that likely formed during MIS 5. The peak of the detrended KDE between ~130 ka and ~110 ka during MIS 5 corresponds to the timing of the formation of most of these large lakes. Both the high growth frequency of speleothems and the presence of African megalakes generally occurred during the last two interglacials.
The observed consistency in speleothem growth frequency and the development of African megalakes supports the correlation between Mediterranean winter rainfall and WAM, lending support to evidence from Southern Europe42. The timing of increased WAM strength is linked to increased winter precipitation in the Mediterranean, particularly during phases of precession minima that cause Northern Hemisphere summer insolation (NHSI) maxima and winter insolation (NHWI) minima42. The strengthening of monsoons during NHSI maxima in the Northern Hemisphere is due to a northward shift in atmospheric circulation, including the Hadley cells and the ITCZ in summer65. This shift increases subsidence and creates persistent high-pressure systems over the Mediterranean, resulting in warm, dry summers66 and high sea surface temperatures67. In winter, the decrease in NHWI has contributed to a diminished meridional temperature gradient; simultaneously, the growing contrast between elevated sea surface temperature and cooler continental air temperature66 has stimulated increased precipitation within the Mediterranean region and Northern Africa. This is supported by precipitation simulations that show a positive anomaly from September to November, along with a low 800 hPa geopotential height anomaly in the western Mediterranean42. The lines of evidence suggest that both the westerlies in winter and the WAM in summer contributed to maintaining humidity in Northern Africa during interglacial periods with low precession insolation.
Conclusions
We identified humid-arid periods over the past 300 ka using ages of speleothem formation for Ghar Kriz Cave and La Mine Cave sites in Tunisia, Northern Africa. The results indicate that speleothem growth predominantly occurred during interglacial periods, with significant peaks at MIS 7c and 5 e, and the most recent AHP. Our data indicate that speleothem growth in northmost Africa was associated with winter precipitation influenced by the southward shift of the westerlies and Mediterranean storm tracks, rather than being directly affected by the WAM. The consistency between speleothem growth and the presence of African megalakes highlights that, in addition to summer precipitation from the WAM, winter moisture from the westerlies was crucial for sustaining humidity across Northern Africa during the interglacials.
Methods
Speleothem specimens
In this study, we analysed a total of 21 speleothems, which include 16 stalagmites, 4 stalactites, and 1 flowstone, collected from north-central Tunisian caves Ghar Kriz (n = 2, GH, 36.44°N, 9.38°E, >500 m a.s.l., site 1 in Fig. 1) in 2018 and La Mine (n = 19, LAM/LM, 36.03°N, 9.68°E, 975 m a.s.l., site 2 in Fig. 1) in 2018 and 2022. Ghar Kriz Cave is located around 50 kilometres to the west of La Mine Cave; the former has a humidity of 92.7% and a temperature of 20 °C (January 2024), while the latter has a humidity of 99.5% and a temperature of 17 °C (October 2022). The sampled material includes only 2 active speleothem formations, where water dripping from the ceiling was collected. The remaining samples consist of fossil speleothems with weathered surfaces.
U-Th dating
A total of 22 subsamples from Ghar Kriz Cave and 141 subsamples from La Mine Cave were analysed for U–Th dating30,68,69. The layers of distinct colour changes in the halved and polished speleothems are assumed to indicate hiatuses in speleothem deposition. Subsamples were taken from the top and bottom of each specimen, and from above and below the inferred hiatuses. Additionally, 48 subsamples were randomly drilled from different age gaps, e.g., one date of 89.44 ± 0.47 ka falls between the age gap of 112.7 ± 2.1 and 81.69 ± 0.37 ka in LAM-8, or duplicated crucial ages, e.g., 2 dates of 21.65 ± 0.13 and 22.66 ±0.24 ka in LM22-19, indicating the timing of redeposition.
Powdered subsamples of 10–100 mg each, were used for U-Th chemistry68 and analyses30. The chemistry procedure was conducted on class-100 benches in the class-10000 subsampling room at the High-Precision Mass Spectrometry and Environment Change Laboratory (HISPEC), Department of Geosciences, National Taiwan University (NTU). U and Th isotopic compositions were analysed on a multiple-collector inductively-coupled-plasma mass spectrometer (MC-ICP-MS), Thermo-Fisher Neptune30. Half-lives of U-Th nuclides used are listed in Cheng et al.70. U-Th ages were calculated using an assumed initial atomic 230Th/232Th ratio of 4 (±2) · 10–6. Uncertainties in the U-Th data are provided at a two-sigma (2σ) uncertainty level (or 2σm). Ages are presented relative to AD 1950, hence reported as ka before present.
We include speleothem ages determined to be within 300 ka and excluded ages older than 300 ka that feature large uncertainties, for example, ±5 kyr at 316 ka and ±14 kyr at 354 ka. Additionally, the lower part of LAM-4, which is older than 224 ka, was excluded due to age reversals. The uppermost portions of stalagmites LAM22-7 and LAM22-9 were also excluded due to possible dissolution effect. Thirty-one dates have been removed, leaving 132 ages subsamples, for which U-Th isotopic compositions and contents and determined ages are listed in Supplementary Data 1. Part of the results from dating have been reported in Sebi et al.32. 238U concentrations in subsamples range from 29 to 923 × 10−9 g/g and, detrital 232Th concentrations vary from 0.017 to 211 × 10−9 g/g.
Age distribution model
The age distribution model described by Weij et al.25,71 was applied to reconstruct the speleothem growth frequency trend. A kernel density estimator (KDE) based on Monte-Carlo simulations that use as input both chronological and analytical uncertainties to randomise the U-Th age distributions25. The KDE age distribution model of Weij et al.25,71 assumes a single representative age for each speleothem. Using large 5-kyr increments reduces the ability to pinpoint the exact position of peaks but increases their statistical robustness, whereas smaller increments improve the precision of peak locations at the expense of significance24. For the timescale considered here, a 5-kyr increment provided an optimal balance between grouping similar speleothem ages and maintaining sufficient temporal resolution in the record24. To extend the model to speleothems with multiple age determinations, we modified the KDE-based approach of Weij et al.25,71. Ages within a 10-kyr interval in the same speleothem were merged into a single weighted mean age before the Monte Carlo simulations. The choice of 10-kyr thresholds represents a practical, empirically derived approximation, where 10-kyr corresponds roughly to twice the typical analytical uncertainty (≈2σ) for 5-kyr, rather than a strict statistical criterion. This approach reduces sampling bias from closely spaced ages within individual stalagmites.
Removal of the exponential baseline from the age distribution curve enhances the representation of the underlying palaeoclimate trend and the relative prominence of individual peaks24. After subtracting the fitted exponential baseline (y = 0.0070 e–0.01x + 4.4 e–0.5, R2 = -0.38) from the KDE curve, the detrended KDE is shown in Fig. 2b. KDE and detrended KDE data are available in Supplementary Data 2.
Data availability
All speleothem data are all provided in the Supplementary Information and also publicly available at the Zenodo repository: https://zenodo.org/records/18263360.
Code availability
The modified KDE code, modified from ref. 25, is available in the supplementary.
References
Middleton, N. & Kang, U. Sand and dust storms: impact mitigation. Sustainability 9, 1053 (2017).
Hublin, J. J. et al. New fossils from Jebel Irhoud, Morocco and the pan-African origin of Homo sapiens. Nature 546, 289–292 (2017).
Sahnouni, M. et al. 1.9-million- and 2.4-million-year-old artifacts and stone tool–cutmarked bones from Ain Boucherit, Algeria. Science 362, 1297–1301 (2018).
Xoplaki, E., González-Rouco, J. F., Luterbacher, J. & Wanner, H. Wet season Mediterranean precipitation variability: influence of large-scale dynamics and trends. Clim. Dyn. 23, 63–78 (2004).
Ait Brahim, Y. et al. The spatiotemporal extent of the Green Sahara during the last glacial period. iScience 26, 107018 (2023).
Cheddadi, R. et al. Early Holocene greening of the Sahara requires Mediterranean winter rainfall. Proc. Natl. Acad. Sci. USA 118, e2024898118 (2021).
Sha, L. et al. How far north did the African monsoon fringe expand during the African Humid Period? Insights from southwest Moroccan speleothems. Geophys. Res. Lett. 46, 14093–14102 (2019).
Hoffmann, D. L. et al. Timing and causes of North African wet phases during the last glacial period and implications for modern human migration. Sci. Rep. 6, 36367 (2016).
Kutzbach, J. E., Chen, G., Cheng, H., Edwards, R. L. & Liu, Z. Potential role of winter rainfall in explaining increased moisture in the Mediterranean and Middle East during periods of maximum orbitally-forced insolation seasonality. Clim. Dyn. 42, 1079–1095 (2014).
Messori, G., Gaetani, M., Zhang, Q., Zhang, Q. & Pausata, F. S. R. The water cycle of the mid-Holocene West African monsoon: the role of vegetation and dust emission changes. Int. J. Climatol. 39, 1927–1939 (2019).
Bosmans, J. H. C., Drijfhout, S. S., Tuenter, E., Hilgen, F. J. & Lourens, L. J. Response of the North African summer monsoon to precession and obliquity forcings in the EC-Earth GCM. Clim. Dyn. 44, 279–297 (2015).
Pausata, F. S. R. et al. The Greening of the Sahara: past changes and future implications. One. Earth 2, 235–250 (2020).
Bordoni, S. & Schneider, T. Monsoons as eddy-mediated regime transitions of the tropical overturning circulation. Nat. Geosci. 1, 515–519 (2008).
Tjallingii, R. et al. Coherent high- and low-latitude control of the northwest African hydrological balance. Nat. Geosci. 1, 670–675 (2008).
Armstrong, E., Tallavaara, M., Hopcroft, P. O. & Valdes, P. J. North African humid periods over the past 800,000 years. Nat. Commun. 14, 5549 (2023).
Larrasoaña, J. C., Roberts, A. P. & Rohling, E. J. Dynamics of green Sahara periods and their role in hominin evolution. PLoS One 8, e76514 (2013).
Tierney, J. E., Pausata, F. S. R. & DeMenocal, P. B. Rainfall regimes of the Green Sahara. Sci. Adv. 3, e1601503 (2017).
deMenocal, P. B. & Tierney, J. E. Green Sahara: African humid periods paced by. Earth’s. Orbital Chang. Nat. Educ. Knowl. 3, 12 (2012).
Kutzbach, J. E. Monsoon climate of the early Holocene: climate experiment with the earth's orbital parameters for 9000 years ago. Science 214, 59–61 (1981).
García-Ruiz, J. M., López-Moreno, I. I., Vicente-Serrano, S. M., Lasanta-Martínez, T. & Beguería, S. Mediterranean water resources in a global change scenario. Earth Sci. Rev. 105, 121–139 (2011).
Lüning, S., Gałka, M., Danladi, I. B., Adagunodo, T. A. & Vahrenholt, F. Hydroclimate in Africa during the medieval climate anomaly. Palaeogeogr. Palaeoclimatol. Palaeoecol. 495, 309–322 (2018).
Ait Brahim, Y. et al. Multi-decadal to centennial hydro-climate variability and linkage to solar forcing in the Western Mediterranean during the last 1000 years. Sci. Rep. 8, 17446 (2018).
Blanchet, C. L. et al. Drivers of river reactivation in North Africa during the last glacial cycle. Nat. Geosci. 14, 97–103 (2021).
Scroxton, N. et al. Natural attrition and growth frequency variations of stalagmites in southwest Sulawesi over the past 530,000 years. Palaeogeogr. Palaeoclimatol. Palaeoecol. 441, 823–833 (2016).
Weij, R. et al. Elevated Southern Hemisphere moisture availability during glacial periods. Nature 626, 319–326 (2024).
Henselowsky, F. et al. Speleothem growth phases in the central Eastern Desert of Egypt reveal enhanced humidity throughout MIS 5. Quat. Int. 657, 26–36 (2023).
Burns, S. J., Fleitmann, D., Matter, A., Neff, U. & Mangini, A. Speleothem evidence from Oman for continental pluvial events during interglacial periods. Geology 29, 623–626 (2001).
Gascoyne, M., Schwarcz, H. P. & Ford, D. C. Uranium-series ages of speleothem from northwest England: correlation with Quaternary climate. Philos. Trans. R. Soc. Lond. B Biol. Sci. 301, 143–164 (1983).
Stoll, H. M. et al. Paleoclimate and growth rates of speleothems in the northwestern Iberian Peninsula over the last two glacial cycles. Quat. Res. 80, 284–290 (2013).
Shen, C.-C. et al. High-precision and high-resolution carbonate 230Th dating by MC-ICP-MS with SEM protocols. Geochim. Cosmochim. Acta 99, 71–86 (2012).
Celle-Jeanton, H., Travi, Y. & Blavoux, B. Isotopic typology of the precipitation in the Western Mediterranean region at three different time scales. Geophys. Res. Lett. 28, 1215–1218 (2001).
Sbei, E., Ben Ouezdou, H., Lone, M. A., Chung, Y.-C. & Shen, C.-C. Apport des dépôts endokarstiques à la reconstitution des paléo-morphologies d’un endo-karst épigène: l’exemple de la grotte de la Mine de Jbel Es Serj (Tunisie centrale). Bull. Soc. Géogr. Liège 82, 5–18 (2024).
Gueddiche, M. et al. Étude sismotectonique de la Tunisie nord-orientale. Bull. Soc. Géol. Fr. 169, 789–796 (1998).
Niedermeyer, E. M. et al. Orbital- and millennial-scale changes in the hydrologic cycle and vegetation in the western African Sahel: insights from individual plant wax δD and δ13C. Quat. Sci. Rev. 29, 2996–3005 (2010).
Shanahan, T. M. et al. The time-transgressive termination of the African humid period. Nat. Geosci. 8, 140–144 (2015).
Larrasoaña, J. C. A review of West African monsoon penetration during Green Sahara periods: implications for human evolution and dispersals over the last three million years. Oxford Open Clim. Change 1, kgab011 (2021).
Genty, D. et al. Timing and dynamics of the last deglaciation from European and North African δ13C stalagmite profiles—comparison with Chinese and South Hemisphere stalagmites. Quat. Sci. Rev. 25, 2118–2142 (2006).
Camuera, J. et al. Past 200 kyr hydroclimate variability in the western Mediterranean and its connection to the African Humid Periods. Sci. Rep. 12, 9050 (2022).
Montaldo, N. & Sarigu, A. Potential links between the North Atlantic Oscillation and decreasing precipitation and runoff on a Mediterranean area. J. Hydrol. 553, 419–437 (2017).
Wassenburg, J. A. et al. Reorganization of the North Atlantic Oscillation during early Holocene deglaciation. Nat. Geosci. 9, 602–605 (2016).
Hurrell, J. W. Decadal trends in the North Atlantic oscillation: regional temperatures and precipitation. Science 269, 676–679 (1995).
Wagner, B. et al. Mediterranean winter rainfall in phase with African monsoons during the past 1.36 million years. Nature 573, 256–260 (2019).
Stockhecke, M. et al. Millennial to orbital-scale variations of drought intensity in the Eastern Mediterranean. Quat. Sci. Rev. 133, 77–95 (2016).
Tzedakis, P. C. et al. Enhanced climate instability in the North Atlantic and southern Europe during the Last Interglacial. Nat. Commun. 9, 1–14 (2018).
Grant, K. M. et al. Rapid coupling between ice volume and polar temperature over the past 50,000 years. Nature 491, 744–747 (2012).
Ait Brahim, Y. et al. North Atlantic ice-rafting, ocean and atmospheric circulation during the Holocene: insights from western Mediterranean speleothems. Geophys. Res. Lett. 46, 7614–7623 (2019).
Ruan, J. et al. Evidence of a prolonged drought ca. 4200 yr BP correlated with prehistoric settlement abandonment from the Gueldaman GLD1 Cave, Northern Algeria. Clim 12, 1–4 (2016).
El-Shenawy, M. I., Kim, S. T., Schwarcz, H. P., Asmerom, Y. & Polyak, V. J. Speleothem evidence for the greening of the Sahara and its implications for the early human dispersal out of sub-Saharan Africa. Quat. Sci. Rev. 188, 67–76 (2018).
Li, Y., Song, Y., Yin, Q., Han, L. & Wang, Y. Orbital and millennial northern mid-latitude westerlies over the last glacial period. Clim. Dyn. 53, 3315–3324 (2019).
Naafs, B. D. A., Hefter, J. & Stein, R. Millennial-scale ice rafting events and Hudson Strait Heinrich (-like) events during the late Pliocene and Pleistocene: a review. Quat. Sci. Rev. 80, 1–28 (2013).
Chung, Y.-C. et al. Stalagmite-inferred European westerly drift in the early Weichselian with centennial-scale variability in marine isotope stage 5a. Quat. Sci. Rev. 288, 107581 (2022).
de Menocal, P. et al. Abrupt onset and termination of the African Humid Period: rapid climate responses to gradual insolation forcing. Quat. Sci. Rev. 19, 347–361 (2000).
deMenocal, P. B. Climate and human evolution. Science 331, 540–542 (2011).
Grant, K. M. et al. A 3 million year index for North African humidity/aridity and the implication of potential pan-African Humid periods. Quat. Sci. Rev. 171, 100–118 (2017).
Drake, N. A. et al. Palaeohydrology of the Fazzan Basin and surrounding regions: the last 7 million years. Palaeogeogr. Palaeoclimatol. Palaeoecol. 263, 131–145 (2008).
Drake, N. A., Blench, R. M., Armitage, S. J., Bristow, C. S. & White, K. H. Ancient watercourses and biogeography of the Sahara explain the peopling of the desert. Proc. Natl. Acad. Sci. USA 108, 458–462 (2011).
Armitage, S. J., Bristow, C. S. & Drake, N. A. West African monsoon dynamics inferred from abrupt fluctuations of Lake Mega-Chad. Proc. Natl. Acad. Sci. USA 112, 8543–8548 (2015).
Leblanc, M. et al. Reconstruction of Megalake Chad using shuttle radar topographic mission data. Palaeogeogr. Palaeoclimatol. Palaeoecol. 239, 16–27 (2006).
Caussé, C. et al. Humidity changes in southern Tunisia during the Late Pleistocene inferred from U-Th dating of mollusc shells. Appl. Geochem. 18, 1691–1703 (2003).
Ghoneim, E. & El-Baz, F. DEM-optical-radar data integration for palaeohydrological mapping in the northern Darfur, Sudan: implication for groundwater exploration. Int. J. Remote Sens. 28, 5001–5018 (2007).
Barrows, T. T. et al. A White Nile megalake during the last interglacial period. Geology 42, 163–166 (2014).
Maxwell, T. A., Issawi, B. & Haynes, C. V. Evidence for Pleistocene lakes in the Tushka region, South Egypt. Geology 38, 1135–1138 (2010).
Caussé, C. et al. Two high levels of continental waters in the southern Tunisian chotts at about 90 and 150 ka. Geology 17, 922–925 (1989).
Zouari, K., Chkir, N. & Caussé, C. Pleistocene humid episodes in southern Tunisian chotts. Isotopic Tech. Study Environ. Change 18, 543–554 (1998).
D’Agostino, R., Bader, J., Bordoni, S., Ferreira, D. & Jungclaus, J. Northern Hemisphere monsoon response to mid-Holocene orbital forcing and Greenhouse gas-induced global warming. Geophys. Res. Lett. 46, 1591–1601 (2019).
Bosmans, J. H. C. et al. Precession and obliquity forcing of the freshwater budget over the Mediterranean. Quat. Sci. Rev. 123, 16–30 (2015).
Martrat, B., Jimenez-Amat, P., Zahn, R. & Grimalt, J. O. Similarities and dissimilarities between the last two deglaciations and interglaciations in the North Atlantic region. Quat. Sci. Rev. 99, 122–134 (2014).
Shen, C.-C. et al. Measurement of attogram quantities of 231Pa in dissolved and particulate fractions of seawater by isotope dilution thermal ionization mass spectroscopy. Anal. Chem. 75, 1075–1079 (2003).
Shen, C.-C. et al. Variation of initial 230Th/232Th and limits of high precision U-Th dating of shallow-water corals. Geochim. Cosmochim. Acta 72, 4201–4223 (2008).
Cheng, H. et al. Improvements in 230Th dating, 230Th and 234U half-life values, and U-Th isotopic measurements by multi-collector inductively coupled plasma mass spectrometry. Earth Planet. Sci. Lett. 371–372, 82–91 (2013).
Weij, R. et al. An exploration of the utility of speleothem age distributions for palaeoclimate assessment. Quat. Geochronol. 60, 101112 (2020).
Perez-Mejias, C. et al. Abrupt climate changes during Termination III in Southern Europe. Proc. Natl. Acad. Sci. USA 114, 10047–10052 (2017).
Drake, N. A. et al. Sedimentary and geomorphic evidence of Saharan megalakes: a synthesis. Quat. Sci. Rev. 276, 107318 (2022).
Ryan, W. B. F. et al. Global multi-resolution topography (GMRT) synthesis data set. Geochem. Geophys. Geosyst. 10, Q03014 (2009).
Spratt, R. M. & Lisiecki, L. E. A Late Pleistocene sea level stack. Clim 12, 1079–1092 (2016).
Lisiecki, L. E. & Raymo, M. E. A Pliocene-Pleistocene stack of 57 globally distributed benthic δ¹⁸O records. Paleoceanography 20, 1–17 (2005).
Caussé, C. et al. Le dernier humide pléistocène du Sahara nord-occidental daterait de 80-100 000 ans. Comptes Rendus Acad. Sci. Série 2, 1459–1464 (1988).
Drake, N. A. et al. Reconstructing palaeoclimate and hydrological fluctuations in the Fezzan Basin (southern Libya) since 130 ka: A catchment-based approach. Quat. Sci. Rev. 200, 376–394 (2018).
Acknowledgements
This work and U-Th dating received support from the National Science and Technology Council, Taiwan, ROC, under grants 114-2116-M-002-016-MY3 (C.-C.S.), 111-2116-M-002-022-MY3 (C.-C.S.), 111-2926-I-002-510-G (C.-C.S.), the Higher Education Sprout Project of the Ministry of Education, Taiwan, ROC, 112L901001 (C.-C.S.), National Taiwan University, Taiwan, ROC, 112L894202 (C.-C.S.). This research also received support from the Pilot Programme for Elite Doctoral Scholarship from the Ministry of Science and Technology and National Taiwan University (Y.-C.C.), the EDUFI Fellowship from the Finnish National Agency for Education (Y.-C.C.), and Research Council of Finland 341622 (A.K.). We would like to express our deep gratitude to the Tunisian Ministry of Higher Education and Scientific Research for financial support and to the Caving and Climbing Association of Zaghouan-Tunisia, led by Mr. Maher Mlaouhia for the assistance during fieldwork. All speleothem samples used in this study were collected with official permission. We sincerely thank Dr. Rieneke Weij for sharing the initial KDE frequency curves and for her valuable suggestions; the final version presented in this manuscript was modified by the authors. We thank the three anonymous reviewers for their constructive comments and suggestions, which helped improve the clarity and quality of this manuscript.
Author information
Authors and Affiliations
High-Precision Mass Spectrometry and Environment Change Laboratory (HISPEC), Department of Geosciences, National Taiwan University, Taipei, Taiwan, ROC
Yun-Chuan Chung, Mahjoor Ahmad Lone & Chuan-Chou Shen
Department of Geosciences and Geography, University of Helsinki, Helsinki, Finland
Yun-Chuan Chung, Heikki Seppä & Anu Kaakinen
Research Laboratory of Environmental Chemistry and Clean Processes (LR21ES04), Department of Chemistry, Faculty of Sciences, University of Monastir, Monastir, Tunisia
Hatem Dhaouadi
Centro de Investigación Mariña, GEOMA, Palaeoclimatology Lab, Universidade de Vigo, Vigo, Spain
Gianluca Marino
Laboratory of Geomorphological Mapping of Media, Environments and Dynamics (CGMED), Faculty of Human and Social Sciences of Tunis, University of Tunis, Tunis, Tunisia
Emna Sbei & Hédi Ben Ouezdou
Department of Geography and Environmental Sciences, Northumbria University, Newcastle upon Tyne, UK
Mahjoor Ahmad Lone
School of Environmental and Life Sciences, The University of Newcastle, Newcastle, NSW, Australia
Silvia Frisia
- Yun-Chuan ChungView author publications
Search author on:PubMed Google Scholar
- Hatem DhaouadiView author publications
Search author on:PubMed Google Scholar
- Gianluca MarinoView author publications
Search author on:PubMed Google Scholar
- Emna SbeiView author publications
Search author on:PubMed Google Scholar
- Heikki SeppäView author publications
Search author on:PubMed Google Scholar
- Anu KaakinenView author publications
Search author on:PubMed Google Scholar
- Mahjoor Ahmad LoneView author publications
Search author on:PubMed Google Scholar
- Hédi Ben OuezdouView author publications
Search author on:PubMed Google Scholar
- Silvia FrisiaView author publications
Search author on:PubMed Google Scholar
- Chuan-Chou ShenView author publications
Search author on:PubMed Google Scholar
Contributions
C.-C.S. and H.D. led the programme; H.D., C.-C.S. and M.A.L. initiated this collaborative project; Y.-C.C. designed this research topic; C.-C.S., Y.-C.C., H.D., E.S., M.A.L., H.B.O., H.S., and A.K. conducted the fieldwork; H.D. and E.S. collected and provided cave information; Y.-C.C. and C.-C.S. conducted U-Th dating; Y.-C.C. created the figures; Y.-C.C. wrote the initial manuscript with input from H.S., A.K., and C.-C.S.; Y.-C.C., G.M., C.-C.S., and S.F. revised the manuscript with input from all co-authors.
Corresponding author
Correspondence to Chuan-Chou Shen.
Ethics declarations
Competing interests
The authors declare no competing interests.
Peer review
Peer review information
Communications Earth and Environment thanks the anonymous reviewers for their contribution to the peer review of this work. Primary Handling Editors: Carolina Ortiz Guerrero and Mengjie Wang. [A peer review file is available].
Additional information
Publisher’s note Springer Nature remains neutral with regard to jurisdictional claims in published maps and institutional affiliations.
Supplementary information
Rights and permissions
Open Access This article is licensed under a Creative Commons Attribution-NonCommercial-NoDerivatives 4.0 International License, which permits any non-commercial use, sharing, distribution and reproduction in any medium or format, as long as you give appropriate credit to the original author(s) and the source, provide a link to the Creative Commons licence, and indicate if you modified the licensed material. You do not have permission under this licence to share adapted material derived from this article or parts of it. The images or other third party material in this article are included in the article’s Creative Commons licence, unless indicated otherwise in a credit line to the material. If material is not included in the article’s Creative Commons licence and your intended use is not permitted by statutory regulation or exceeds the permitted use, you will need to obtain permission directly from the copyright holder. To view a copy of this licence, visit http://creativecommons.org/licenses/by-nc-nd/4.0/.
About this article
Cite this article
Chung, YC., Dhaouadi, H., Marino, G. et al. Three hundred thousand years of multi-millennial hydroclimate variability in Northern Africa based on speleothem records from Tunisia. Commun Earth Environ 7, 251 (2026). https://doi.org/10.1038/s43247-026-03236-1
Received: 26 December 2024
Accepted: 19 January 2026
Published: 10 February 2026
Version of record: 18 March 2026
DOI: https://doi.org/10.1038/s43247-026-03236-1
Share this article
Anyone you share the following link with will be able to read this content:
Get shareable linkSorry, a shareable link is not currently available for this article.
Copy shareable link to clipboardProvided by the Springer Nature SharedIt content-sharing initiative
Orbital controls on eastern African hydroclimate in the Pleistocene
Article Open access 24 February 2022
Reversed Holocene temperature–moisture relationship in the Horn of Africa
Article Open access 09 August 2023
Astronomically controlled aridity in the Sahara since at least 11 million years ago
Article 25 July 2022Related Topics
Keywords
Related Stories
Ebola: No new cases in Nigeria as two suspected cases in North-east test negative
Details obtained exclusively by PREMIUM TIMES revealed that a 34-year-old pilot and his wife, a medical doctor, are the two people suspected of having Ebola virus disease in Adamawa State, North-east Nigeria. The post Ebola: No new cases in Nigeria as two suspected cases in…

Ebola: Saudi Arabia suspends travel to Kenya, halts visa issuance
The Saudi Press Agency (SPA) announced the measures in a statement published on its official X account on Friday, 30 October, saying they followed epidemiological assessments by the country’s health authorities The post Ebola: Saudi Arabia suspends travel to Kenya, halts visa…

Group seeks end to health workers’ absenteeism in PHCs
“Our expectation is that the government and other policymakers will take renewed action to ensure that these interventions are implemented across the state,” the group's coordinator said. The post Group seeks end to health workers’ absenteeism in PHCs appeared first on Premium…

Catholic diocese, CAN reject inclusion of clerics in APC campaign list
PREMIUM TIMES reports that the APC in the state had included Mr Obodo and many other Christian clerics in the party's governorship campaign council. The post Catholic diocese, CAN reject inclusion of clerics in APC campaign list appeared first on Premium Times Nigeria.

Top Stories

Hamilton takes first pole for Ferrari at Mexico City Grand Prix

These firms you've never heard of are feeding fears the AI bubble could burst

How the downfall of Serbia's Vučiċ mirrored that of Hungary's Orbán

College football winners, losers: Oregon's Dylan Raiola bounces back, Wisconsin falls flat

On 'tense' Antonelli's big weekend, this was Hamilton's day

Thick fog to create hazardous driving conditions into next week

Oklahoma offense stuck in neutral: Loss to South Carolina highlights key decisions ahead for Brent Venables

No more washing up: How Airbnb's new house rules have divided hosts and guests
Latest
Hamilton takes first pole for Ferrari at Mexico City Grand Prix
These firms you've never heard of are feeding fears the AI bubble could burst
How the downfall of Serbia's Vučiċ mirrored that of Hungary's Orbán
College football winners, losers: Oregon's Dylan Raiola bounces back, Wisconsin falls flat
On 'tense' Antonelli's big weekend, this was Hamilton's day
Thick fog to create hazardous driving conditions into next week
Oklahoma offense stuck in neutral: Loss to South Carolina highlights key decisions ahead for Brent Venables
No more washing up: How Airbnb's new house rules have divided hosts and guests