Cape Town property prices surge 12%, more than twice Johannesburg's increase
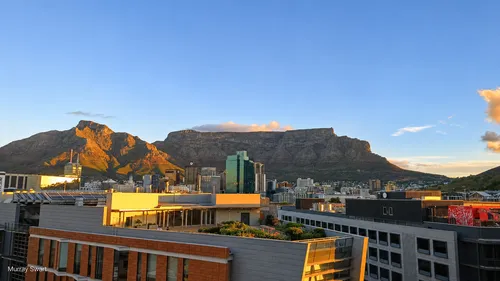
Cape Town's property prices rose 12% in a year, compared with 4.9% in Johannesburg, while estimated city-centre rents are almost double
Cape Town property prices increased by 12% in the year to June 2026, more than twice Johannesburg's rate, while estimated rents for a one-bedroom apartment in the Mother City's city centre were almost double those in Johannesburg.
Statistics South Africa's latest Residential Property Price Index shows that annual residential property price inflation in Cape Town reached 12%, compared with 4.9% in Johannesburg. A separate Numbeo comparison puts estimated monthly city-centre rent at R17,188 in Cape Town and R8,620 in Johannesburg, highlighting the difference in accommodation costs between the two cities.
The official figures also show that Cape Town recorded higher annual property price increases across sectional title, freehold and resold properties.
Stats SA's June 2026 Residential Property Price Index shows that residential property prices across the country's metropolitan areas increased by 8% over the 12 months.
Cape Town recorded the highest annual increase among the metropolitan areas covered, at 12%, followed by Ekurhuleni at 7.2%. Johannesburg recorded an increase of 4.9%.
At provincial level, the Western Cape recorded residential property price inflation of 11.6%, compared with 4.9% in Gauteng. The figures add context to Cape Town's ongoing housing affordability challenges.
The increases were evident across different property categories.
Sectional title property prices, which include apartments and townhouses, increased by 11.7% year-on-year in Cape Town, compared with 1.4% in Johannesburg.
Freehold property prices, which include standalone houses, increased by 10.4% in Cape Town and 9% in Johannesburg.
The index for resold properties increased by 11.8% in Cape Town, compared with 4.3% in Johannesburg. This adds to the wider picture of South Africa's Western Cape property market.
Numbeo's June 2026 comparison between the two cities highlights the difference in estimated rental costs.
A one-bedroom apartment in Cape Town's city centre was estimated to cost R17,188 a month, compared with R8,620 in Johannesburg.
For one-bedroom apartments outside the city centre, the estimated monthly rent was R10,679 in Cape Town and R6,936 in Johannesburg.
The difference was also evident for larger properties. A three-bedroom apartment in the city centre was estimated to cost R29,010 a month in Cape Town, compared with R17,908 in Johannesburg.
Outside the city centre, the corresponding estimates were R20,847 and R14,953.
Numbeo also estimated the purchase price of an apartment in Cape Town's city centre at R37,954 per square metre, compared with R17,264 in Johannesburg.
Outside the city centre, its estimates were R24,793 per square metre in Cape Town and R12,595 in Johannesburg.
The figures are based on Numbeo's crowdsourced and collected price information. They are estimates rather than official property valuations or verified rental transaction prices.
Numbeo's estimated average monthly net salaries were almost identical in the two cities in June 2026.
Its estimates put Cape Town's average monthly net salary at R27,541, compared with R27,795 in Johannesburg.
However, when these estimates are compared with the cost of renting a one-bedroom apartment in the city centre, the difference becomes more pronounced.
In Cape Town, the estimated monthly rent of R17,188 is equivalent to approximately 62% of Numbeo's estimated average monthly net salary.
In Johannesburg, the estimated rent of R8,620 represents approximately 31% of the corresponding estimated salary.
These calculations are illustrative and do not represent actual household expenditure or individual affordability. They also exclude other monthly expenses, including groceries, transport, electricity and debt repayments. The comparison adds context to wider cost of living pressures facing Cape Town households.
Stats SA's figures show that Cape Town's residential property price index increased by 1% between May and June 2026, compared with 0.4% in Johannesburg.
The index measures changes in residential property prices using transaction information obtained from the Office of the Chief Registrar of Deeds through a third-party data provider.
It covers both new and existing residential properties and uses a statistical model to account for differences in property characteristics.
Stats SA cautions that figures for the latest 12 months are subject to revision as additional transaction information becomes available.
Originally published and reported by IOL South Africa.
Read original coverage on IOL South AfricaRelated Topics
Keywords
Related Stories
STEPPING UP: Simon Harmer’s transition from exile to Proteas’ top Test spinner
The spin bowler will surely be in the running for future Proteas inclusion after a magnificent performance against Australia in Cape Town.

CULTURAL TENSIONS: Is halaal food becoming more common in SA? Debunking viral myths
South Africa’s halaal food debate exposes misunderstandings about Islamic slaughter, religious freedom, voluntary certification and the commercial forces behind the growing number of halaal products.
ActionSA says stronger election result could give it coalition influence
ActionSA says stronger election result could give it coalition influence

Death of the ANC: Party suffers worst municipal result since 1994 as support falls to 30.81 percent
The ANC’s support has fallen to 30.81% in the 2026 local government elections, its worst municipal result since 1994, leaving it without an outright majority in any metro and facing renewed questions about its leadership.

Top Stories
STEPPING UP: Simon Harmer’s transition from exile to Proteas’ top Test spinner
CULTURAL TENSIONS: Is halaal food becoming more common in SA? Debunking viral myths
ActionSA says stronger election result could give it coalition influence

Australia reach World Cup final after Fiji scare
Death of the ANC: Party suffers worst municipal result since 1994 as support falls to 30.81 percent

Baze University acquires two aircraft as founder expands aviation education
Two children killed in Kariega shack fire as father injured trying to rescue them
Resumption of War in Iran after US Mid-Terms


Latest
STEPPING UP: Simon Harmer’s transition from exile to Proteas’ top Test spinner
CULTURAL TENSIONS: Is halaal food becoming more common in SA? Debunking viral myths
ActionSA says stronger election result could give it coalition influence
Australia reach World Cup final after Fiji scare
Death of the ANC: Party suffers worst municipal result since 1994 as support falls to 30.81 percent
Baze University acquires two aircraft as founder expands aviation education
Two children killed in Kariega shack fire as father injured trying to rescue them
Resumption of War in Iran after US Mid-Terms